


The local government sector has taken on total additional borrowing of £50bn over the last decade – and 25 authorities now have more than £1bn of borrowing.
These figures are revealed in the latest Department for Levelling Up, Housing and Communities (DLUHC) data derived from the monthly and quarterly borrowing forms submitted to the department by all local authorities.
Total borrowing, including loans from local government, was £139.7bn at the end of March 2024. This compares to £89.1bn at the end of March 2014, with increases every year since then.
A closer look at the numbers shows that there were fairly small jumps of between £2-5bn in the first three years after the end of March 2014, before bigger annual increases of between £8-11bn in the next three, and then smaller jumps again of £2-3bn – before the latest increase of £4.98bn between the end of March 2023 and 2024.
Arlingclose director David Green sees this latest jump as simply a return to a long-term trend of an around £5bn a year increase.
And Innes Edwards, principal treasury & banking manager for the City of Edinburgh Council, has questioned whether some local authorities are in fact under borrowed against their capital financing requirement, resisting taking out longer-term loans at unfavourable rates.
Indeed, many are taking out short local authority loans “in lieu of long-term borrowing”, or earlier this year dipped into the PWLB where they have for the most part been “going short”.
Edwards has warned that should “something go wrong politically” – with interest rates then rising rather than falling as expected – there are potential dangers.
The £1bn borrowing threshold
If that is the case from an overall perspective, is there any significance in the local authority borrowing ‘big hitters’ with more than £1bn of borrowing? The previous Conservative government appeared to be very worried about some councils having borrowed too much and taken on too much debt: the Office for Local Government too has focused on the issue in its data, leading to a lot of media attention being paid to the debt position of local authorities.
Dan Bates, director at LG improve, has previously criticised Oflog’s “narrow view” when it comes to assessing the capital health of authorities. Focusing just on debt is “one-dimensional”, he says, with debt gearing, a measure of the relationship between debt and equity, offering “a far better picture”.
The following chart shows the 25 local authorities with over £1bn of borrowing [click on the image to enlarge]. This offers an interesting guide but as Bates points out it is just one metric and has to be seen in the context of wider data such as revenue streams, debt service ratios, the asset base and expenditure obligations. The following comments should therefore be viewed in this light.
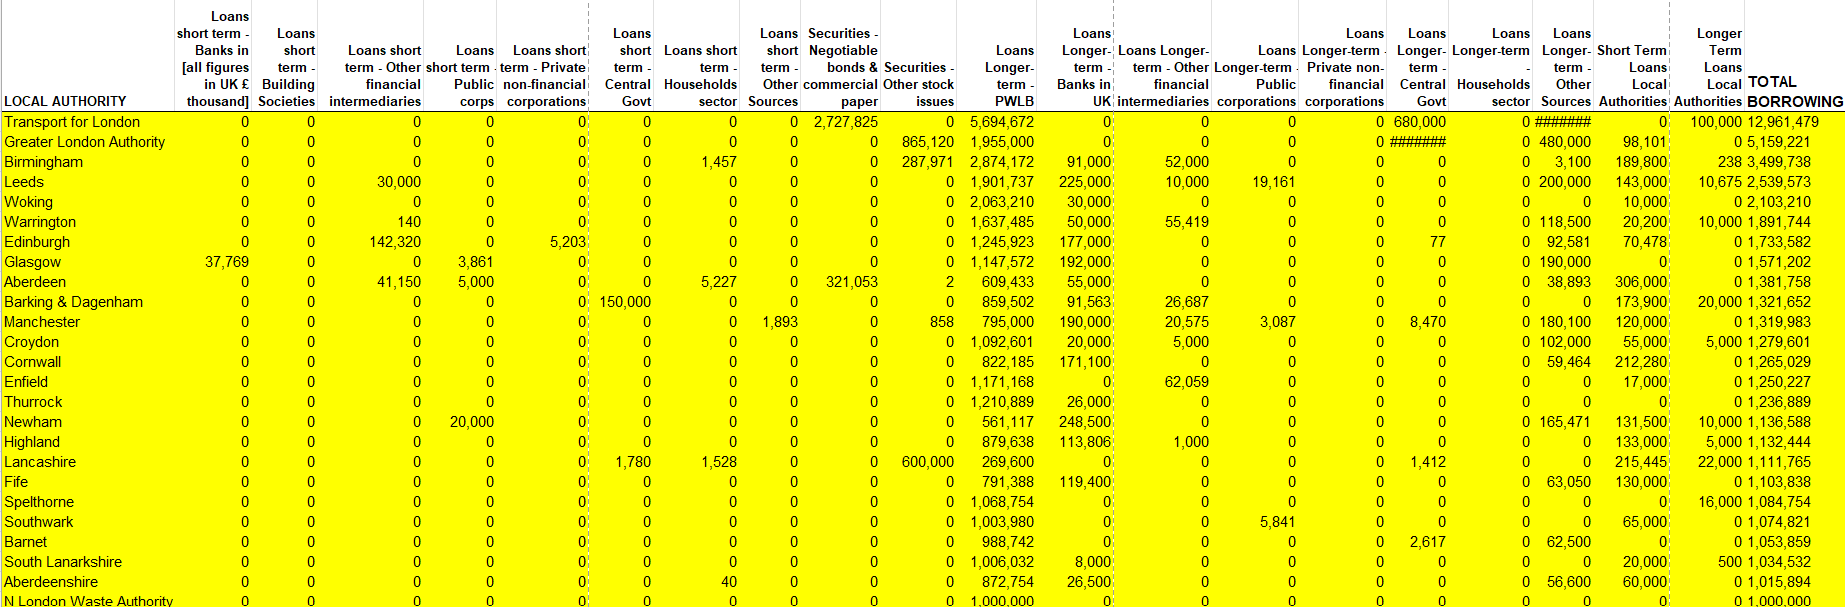
Total borrowing at Birmingham and Woking – councils where high-profile section 114 notices have been issued – is £3.5bn and £2.1bn respectively. Of that, £2.8bn and £2.06bn is in longer-term Public Works Loan Board (PWLB) loans – so almost all of it in Woking’s case and a large portion in Birmingham’s. Birmingham also has £288m in ‘Securities – Other stock issues’.
Croydon and Thurrock too are heavily reliant on the PWLB, restricted as they are by their s114s, but then so are Southwark and South Lanarkshire.
Warrington, which is subject to a Best Value Inspection from DLUHC following a CIPFA assurance review into the council which stated that the authority’s £1.8bn debt position is “concerning” and putting it at “risk”, has £1.64bn of that in PWLB loans.
Spelthorne is similarly subject to a Best Value Inspection after the government deemed its debt-funded investments to be a “clear financial risk”; £1.07bn of its total £1.08bn borrowing is with the PWLB.
Local government’s reliance on the PWLB as a source of local authority borrowing is seen by some as a cause for concern in the sense of putting all eggs in one basket, while fewer options make it harder to get to the price discovery point. Currently though, there are rarely sufficiently good savings in alternative long-term borrowing options to warrant the “extra administrative burden”, as Green has put it.
Most authorities in the list have a good amount of their total borrowing with the PWLB, with some outliers. A pioneer of municipal bonds, Lancashire has £600m in ‘Securities – Other stock issues’ and just £270m in the PWLB of a £1.1bn total borrowing position.
At other councils in the list, longer term bank loans play a significant part in the borrowing position. Leeds has £225m of such loans of total £2.54bn borrowing, with £200m in ‘Loans Longer-term – Other Sources’ and £143m in short term local authority loans. Newham has £248.5m in longer term bank loans compared to £561m in the PWLB of a total £1.14bn borrowing position.
Aberdeen has £321m in ‘Securities – Negotiable bonds & commercial paper’ compared to £609m in the PWLB of a total borrowing position of £1.38bn. Some £306m is in short term local authority loans.
Of course, as well as the size and type of borrowing, the size and overall financial position of the authority is an important consideration in determining the level of risk of borrowing. Some of the authorities in the list have been the subject of much attention; others are generally considered to be very well run financially. Another factor to consider is that those councils with a Housing Revenue Account (HRA) requirement usually have higher debt positions, given their housing responsibilities.
As Bates has noted, capital health is “really complex”. He states that, based on councils’ accounts for 2023/24, debt proportional to CSP is not increasing. This means that “the debt crisis, if there is one, is not getting any worse”.

Perhaps more concerning, he says, is that some authorities are no longer able to sustain internal borrowing, exposing them to the high interest rates on external borrowing.
“There are other parts of the balance sheet that are getting squeezed so much that exposure to high interest rates over the next couple of years, if they continue to be high, is going to add to the financial vulnerability of authorities,” he says.
Local-to-local lending
Nevertheless, media attention on local government’s debt position and wider financial struggles can put authorities in a difficult position. That is probably why a recent article in The Times claiming to list England’s ‘worst-performing councils’, and based heavily on Oflog data, received such a backlash from authorities.
Reputational concerns have impacted the local-to-local lending market, too. For some treasury managers, dealing with a council in or perceived to be in financial difficulty has become more trouble than it is worth in terms of explaining the reality of the situation to members.
Has that been reflected in the numbers? The DLUHC data shows that there was a more than £1bn sell-off of local-to-local loans between the end of December 2023 and the end of March 2024, from £9.63bn to £8.57bn.
Nazmin Miah, director Link Market Services at Link Group, says there could be a “number of reasons” for the reduction of activity in this sector.
“We have seen rates offered in the local authority market elevated from September 2023 through to March 2024, in some cases more expensive than the PWLB and therefore some short-term borrowing was taken from the PWLB as opposed to local authorities,” she explains.
“The number of local authorities facing budgetary pressure and having s114s issued has also had a knock-on effect with regard to the number of local authorities active in the local-to-local lending [market].”
So, possibly. But Arlingclose’s Green does not see any reason for concern. He argues that investments with other local authorities, overall, have held up relatively well, falling only 10% when total investments have dropped 16% in the year.
The next DLUHC data update should offer more clues. However, a longer-term assessment shows that there have been almost as many increases in total local-to-local loans as decreases on a quarterly basis since 2021, meaning a £1bn sell-off might not be so out of the ordinary.

—————
FREE bi-weekly newsletters
Subscribe to Room151 Newsletters
Follow us on LinkedIn
Follow us here
Monthly Online Treasury Briefing
Sign up here with a .gov.uk email address
Room151 Webinars
Visit the Room151 channel