


The latest issue of Room151’s quarterly Private Markets Profile is out now and investigates a new paradox: for the first time in decades, the LGPS is enjoying healthy funding levels, but despite increased talks of de-risking, funds continue to expand their private markets allocations, what drives this trend?

“My name is Neil Mason, and if our actuaries are to be believed, our scheme is currently 137% funded” quipped Mason, assistant director for the Surrey County Council Pension Fund at this year’s Room151 Private Markets Forum.
His comments, though on paper correct, were met with laughter in the room, an indication of the scepticism with which many in the LGPS are approaching their healthy funding ratio.
It is still a good problem to have. According to the latest LGPS Advisory Board Annual Report, for the year 2022 / 2023, the LGPS was on average 107% funded. More recent estimates, such as Isio’s Low Risk Funding Index state that as of May 2024, the LGPS is 110% funded. While the picture varies greatly from fund to fund, this is nevertheless a stark increase compared to March 2022, when the Scheme was 67% funded.
This stark improvement, combined with the dire financial situation of most administering authorities, has raised the question whether LGPS funds should lock in some of those gains by de-risking their asset allocation. After all, this is the trend for corporate DB schemes who have largely shifted their portfolios towards fixed income assets as they position their portfolios for various endgame scenarios. With long-dated bonds yielding in excess of 4% and most forecasters betting in Central Bank rate cuts, surely now is the time to lock in some of those gains?
Asset allocation trends
Yet the picture looks very different for the LGPS, which of course is still open to new members. While the figures are now just over a year old, they do not indicate a shift towards traditional fixed income. On a year-on-year basis, there appears to be very little difference but over a ten year-time frame, the trend becomes much clearer.
LGPS funds have gradually reduced their equity allocations, from 63% in 2014 to 51% in 2023. But rather than drastically increasing their fixed income holdings, they have drastically scaled up their investments in alternatives such as infrastructure, private equity and debt. Ten years ago, alternatives accounted for 8% of the average portfolio, this figure has now risen to 17% as of 2023. And anyone who has followed recent fund launches and asset allocation discussions at pension board meetings will conclude that their share is on track to rise even further. What drives this paradox?
One key reason is the different approach to estimating liabilities compared to corporate DB schemes due to the open nature of the LGPS, according to Philip Pearson, senior investment consultant at Hymans Robertson. “Investment strategies are designed to deliver the returns required to meet not only the past service liabilities reflected in current funding levels, but also the costs of future service. These costs have faced significant upward pressure in recent years from higher-than-expected inflation and benefits changes such as McCloud” he warns.
The longer investment horizon also impacts the potential risk-return profile, explains Joanne Donnelly, head of pensions at the Local Government Association in response to these figures: “As an open DB scheme with generally strong employer covenants, LGPS funds can afford to take more risks that some other investors. That means investing in asset classes where returns cannot be guaranteed in the short-term. That might mean some bumpy years but over the longer term the scheme has consistently outperformed the market.”
Bumpy returns
And returns have indeed been bumpy. Somewhat masked by the overall positive news on funding levels is the fact that LGPS assets have dropped significantly to £354bn, compared to £369bn the previous year, according to the latest Scheme Advisory Board’s latest Annual Report.
The Scheme Advisory Board said this reflected “a challenging year for investments, largely resulting from the economic shocks associated with Russia’s illegal invasion of Ukraine, as well as the Liz Truss/Kwasi Kwarteng “mini budget” in September 2022 domestically.”
But rather surprisingly, the asset class which represented the biggest drag on performance within this time frame were not private markets, often classed as the riskier assets, but presumably “risk free” bonds while equity performance remained flat.
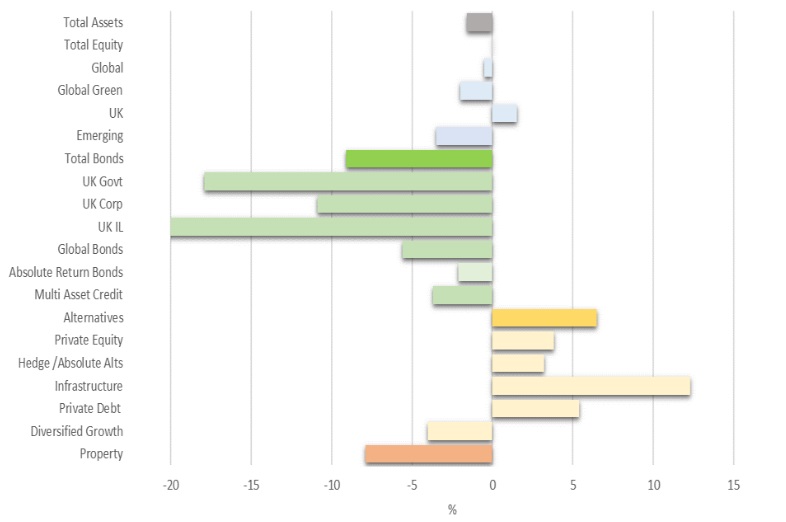
Year on year, UK government bonds, traditionally seen as the least risky asset to invest in, performed -17%, while UK index linked dept delivered a whopping -20%, a poor inflation hedge if there ever was one. Overall, the asset classes offering the highest returns were alternatives with infrastructure in particular offering returns well in excess of 10%. Investors also increasingly turned to private debt which offered returns in excess of 6%.
It is worth adding that these figures are now over a year old and therefore do not accurately reflect the potential challenges which higher central bank rates pose for some private market assets. But for the time being, LGPS demand for private markets does not seem to be saturated just yet.
—————
FREE bi-weekly newsletters
Subscribe to Room151 Newsletters
Follow us on LinkedIn
Follow us here
Monthly Online Treasury Briefing
Sign up here with a .gov.uk email address
Room151 Webinars
Visit the Room151 channel