
 Local authorities have set record council tax rises. Dan Bates argues that as some councils do well from the tax while others suffer it is critical for officers to engage with the upcoming consultation on fair funding.
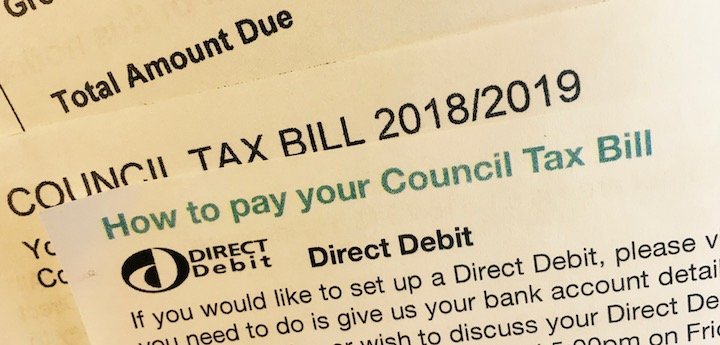
Last week (28 March) the government released council tax statistics for 2018/19. Over three quarters of authorities took advantage of the increase in the capping limit and raised their tax by at least 2.5%. Taken with a third year of the adult social care precept, the average increase in council tax in England was 5.07%, an inflation busting increase for most of us.
Council tax increases are newsworthy — just Google it and you find a raft of stories. Many of these articles quote “average Band D” which can be misleading as it infers that councils with the same Band D rate receive the same relative levels of income from council tax: read on to see why that is not the case.
Disparities
Many commentators have pushed for the tax to be reformed pointing to its regressive nature with bandings remaining unchanged since they were set, based on 1991 property prices. This has thrown up disparities across the country and it is now not uncommon for the media to refer to the “postcode lottery” of council tax.
While it is clear that council tax affects us all, as taxpayers, to differing degrees, the impact on council funding is just as significant.
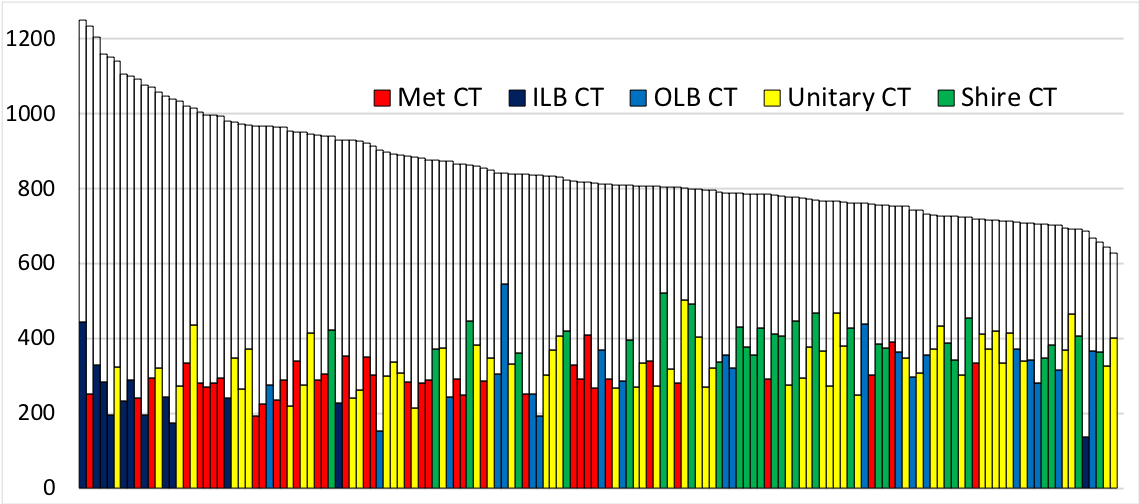
Look at the two graphs below which show spending power per head in 2012-13 and then again in 2018-19 across all 151 upper tier authorities (excluding fire and police).
In shire areas, I have aggregated county and district information. The coloured bars show council tax per head by type of authority and the uncoloured bars show government funding per head; this incorporates settlement funding assessment, as well as all other spending power grants including new homes bonus and improved better care funding.
Spending power per head: 2012-2013
Spending power per head: 2018-2019
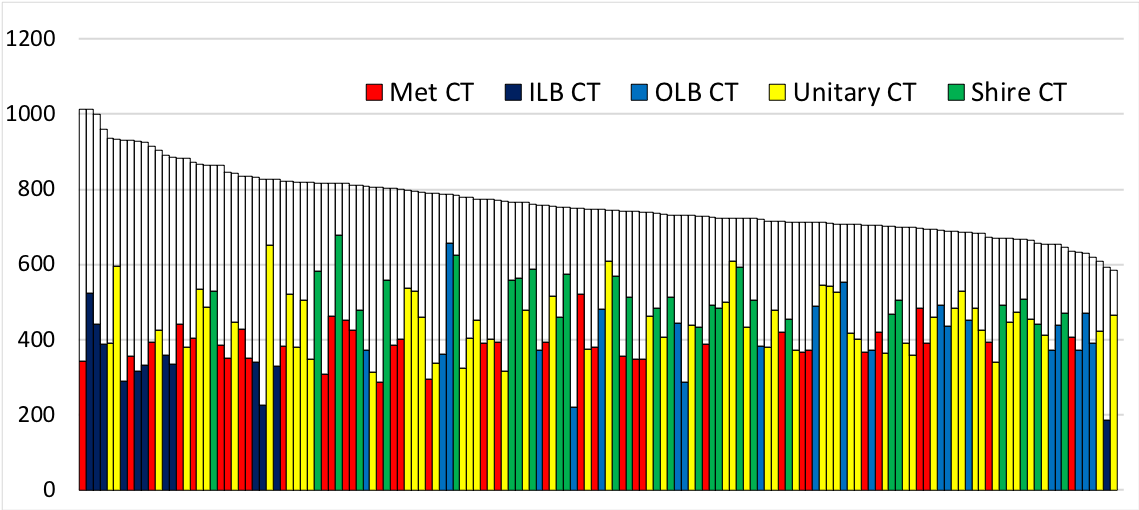
When comparing the two graphs, a number of things jump out:
- The total level of spending power has reduced in the six years between 2012-13 and 2018-19. In money terms, nearly £46bn has reduced to less than £42bn.
- The 2018-19 total spending power graph is a lot flatter than the 2012-13 graph, which shows a significant change in the distribution of spending power. Authorities on the left of the graph, assessed to have the highest needs in 2012-13, have taken the greatest cash decreases. This is largely due to flat rate percentage reductions to funding that were imposed on all authorities in 2014-15 and 2015-16.
- Council tax is now, by some way, the most significant source of funding for local authorities. Increasing by 31% over the period as central government funding reduced by 37%. in 2018-19, local authorities, as a whole, are 60% funded by council tax (41% in 2012-13) and gearing is set to increase as funding further reduces and annual tax increases top 5%.
- Finally, there are big differences in council tax gearing between individual authorities and types of authority. This partly explains the redistribution of spending power with those authorities with high council tax reliance being more sheltered from the severe government funding cuts.
So, a regressive local tax, unreformed since its introduction in 1993 is now the main funding source for local government. This fact, coupled with the large variations in reliance on council tax between authorities, warrants a closer look.
Deconstructing the figures
To better understand the figures in the graphs, I have selected two authorities at opposite ends of the council tax gearing scale, Wokingham and Knowsley.
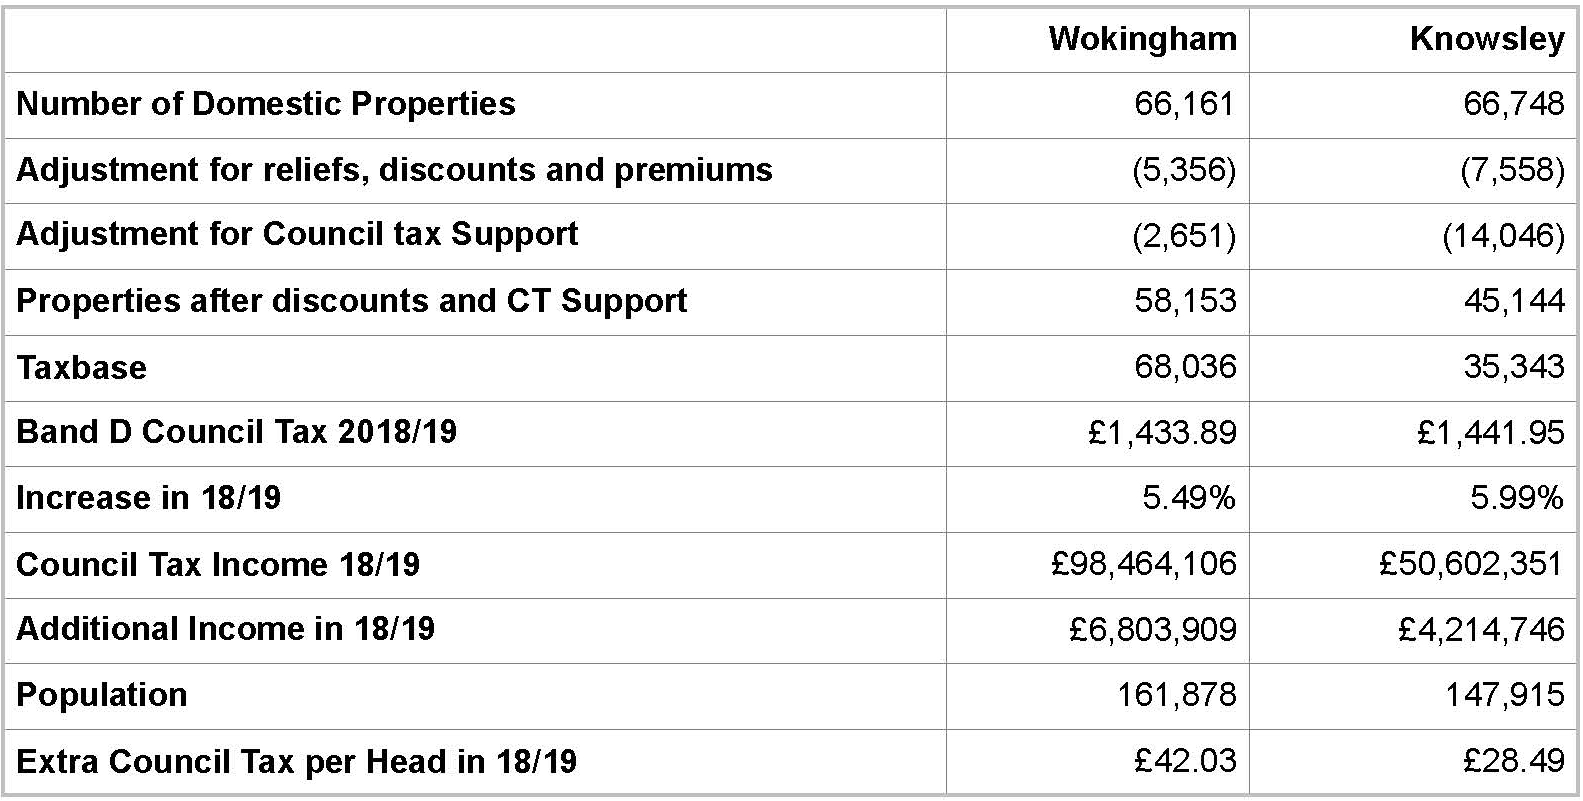
The information in the table above, from the annual council tax requirement returns, shows that Wokingham receives almost double the council tax income from roughly the same number of properties and with a slightly lower Band D rate. There are two main reasons for this.
- Knowsley’s taxbase is reduced by council tax support (CTS), which replaced council tax benefit, and other discounts, mainly single person 25% discount. Although the government compensates for lost CTS via a grant, this has been cut alongside other settlement grants and Knowsley has the difficulty of collecting smaller amounts of council tax from harder to collect previous benefit recipients.
- Houses in Knowsley and Wokingham are banded very differently. Council tax bands are based upon assessed valuation range from A to H with a Band A property paying two thirds of the Band D charge and Band H paying twice the Band D charge. In Knowsley 91% of homes are assessed in Band A-C, in Wokingham its 24%. Only 9% of Knowsley’s properties are Band D-H, in Wokingham its 76%.
So, while Knowsley has roughly the same number of properties as Wokingham, its taxbase, which takes a weighted account of the number of homes in each band, as well as discounts and council tax support, is half that of Wokingham’s and it receives half the level of income from council tax.
Is this fair?
On the face of it, this does seem unfair on low taxbase authorities. Certainly, both national and local media tend to focus on Band D and rarely pick up the issues of council tax support and differential taxbases.
Prior to 2014-15, the government did make an allowance for differences in ability to raise council tax in its funding formulae via the “resources” amount (also known as resources equalisation), a negative amount which is a proxy for how much each authority is able to meet its needs from council tax. Councils with high taxbases received a large negative resources amount to nullify their additional council tax income.
However, the government froze their formulae after 2013-14 and applied roughly equal cuts in government funding to all authorities in 2014-15 and 2015-16. This resulted in a significant redistribution in spending power from low to high taxbase authorities (as shown in the two graphs) with no resource equalisation process. Some pointed to this being manifestly unfair on those councils, many with high needs, which took significantly larger cash decreases in funding over two consecutive years.
In 2016-17, resource equalisation was re-introduced into funding allocations so that those authorities able to raise more council tax received steeper reductions in settlement funding assessment.
Looking over the period covered by the graphs those authorities with higher taxbases have fared better in terms of spending power between 2012-13 and 2018-19. However, they still have spending power per head at levels lower than low taxbase authorities.
Looking forward
So, after seven years of funding cuts local government is now more reliant on council tax: in 2019-20 61.5% of spending power will come from council tax. This is set to rise further as the latest budget statement has implied no additional funding and council tax seems set for further above inflation increases. This creates the risk of a two-tier system based around taxbase levels.
If the funding trend continues, some authorities will virtually become wholly reliant on council tax for their funding. Protected from further government funding cuts, these authorities will argue, with some justification, that it is unfair that taxpayers shoulder the funding burden for pressures including social care, as much a national issue as a local one.
At the other extreme, authorities that are more reliant on reducing government funding will continue to struggle with reductions. The fact that low taxbase authorities are often in deprived areas and have greater needs and spending pressures, makes this a double whammy. Throw in a tendency towards poor economic growth, and less likelihood of business rates growth, and you are approaching a perfect storm.
What to do?
So, what can the government do to address this? It seems certain that they have no plans to consider fairer, more progressive alternatives to council tax such as local income tax. Nor do they seem keen to review council tax bandings so that they are more reflective of current property prices. From the taxpayers view, it seems that council tax is set to stay.
As far as local authorities are concerned, the government’s fair funding review is looking at resources equalisation (papers available on LGA website). As I see it, there are two key issues here.
First, will the resources equalisation reverse the equal percentage funding reductions of 2014-15 and 2015-16 which saw high needs authorities lose large cash sums? To do so would in itself result in significant redistribution of government funding, something governments are not keen on and would seek to ameliorate through damping.
Second, given that government funding will have virtually halved by 2020-21, will there be sufficient resources left to meet increased needs, as well as compensate low taxbase authorities? Ultimately, we will come to a point where there is insufficient, or no, funding left and low taxbase authorities might be left to fall behind.
Alternatively, the government could start redistributing council tax from high taxbase authorities to high needs authorities. As incredible as this scenario might seem, we have already encountered negative revenue support grant so a negative overall funding value (to be met by redistributed council tax) might be closer than you think.
All of this is arises from the year-on-year rise of council tax, an arguably regressive tax, based on 1991 property prices and bearing no correlation to local authority spending pressures. Its place within the fairer funding of local authorities from 2020-21 will soon be subject to consultation and it is important that all local authorities, and interested parties, understand this tax and engage with the consultation.

Dan Bates works for Pixel Financial. His thoughts on local government funding are shared on twitter and LinkedIn.