


Investment costs are a big issue for LGPS. Chris Siers asks whether they are fair.
Is the LGPS paying a fair price for investment services? It’s a good question but with lots of complexity.To answer we need first to know the actual costs, and then we need to be able to compare them to something to determine whether they are “fair” or not.
Moreover, the word “fair” introduces the concept of value-for-money, which has both objective and subjective components; the money is objective and can be calculated but this needs to be viewed through the lens of “value”, which usually means different things for different people. Basically, we all value different things, differently.
Fortunately, if you ask any trustee, or pension fund chief investment officer, what it is they will pay more for, they will immediately say performance. So, to answer the question in the title we need to know the costs, we need to compare them to something, and we probably also need the context of the performance delivered for a given cost.
12th Local Authority Treasurers Investment Forum & FDs’ Summit
NOW A VIRTUAL EVENT + ZOOM151 Networking
Jan 21, 22 & 23, 2021
Costs
To the first point, the LGPS has long been considered the UK’s leader in cost transparency: the Scheme Advisory Board (SAB) was the first to adopt the open cost-data standard published by the Financial Services Consumer Panel in the paper I wrote in 2015, a standard that morphed into the “LGPS templates” and the Code of Transparency.
When the FCA created the Institutional Disclosure Working Group, the Local Government Association had representation and worked with me to develop what are now the Cost Transparenct Initiative (CTI) data standards and the LGA still has a seat on the CTI board. Finally, the SAB has announced the creation of a data collection and validation platform based on the CTI templates for the use of LGPS funds. All this would indicate that the LGPS is still the leader in cost transparency.
Or, perhaps not. Since the adoption of the CTI standard for the Code of Transparency there have been delays, which is worrying and confusing as the CTI templates actually work.
I know this because since January 2019 ClearGlass, my own cost collection and analysis platform, has collected some 4,500 templates of data for more than 300 mostly private sector defined benefit pension schemes for the 2018-19 collection cycle.
Mainly this was using CTI templates, but we also accepted some legacy LGPS templates and DCPT and ILPA data. For the 2019-20 cycle we are in the process of collecting some 10,000 CTI templates-worth of data for almost 1,000 private (and public) sector pension schemes.
This rapid adoption by the private sector means that the LPGS has fallen behind, which is sad as it laid the foundations for wider market adoption and deserves credit for that.
Therefore, information on the first part, the actual costs of the LPGS, is not really available as data is likely to be missing or incomplete. Missing in that it hasn’t been comprehensively collected, and incomplete in that what has been collected previously hasn’t been collected using the holistic framework that is the CTI.
To the latter point, data from the 300+ private sector (and some public sector) defined benefit schemes from which ClearGlass collected information in 2019 shows that upwards of 45% of total costs were “implicit” (Table 1).
The implication being that, as they are implicit, they are unlikely to have been collected before and previously unquantified. Moreover, the higher the allocation to illiquid and private markets a scheme has, the higher the proportion of costs that are implicit, which drives up the overall implicit percentage (Table 2). And the LGPS is not shy when using private equity.
 Comparisons
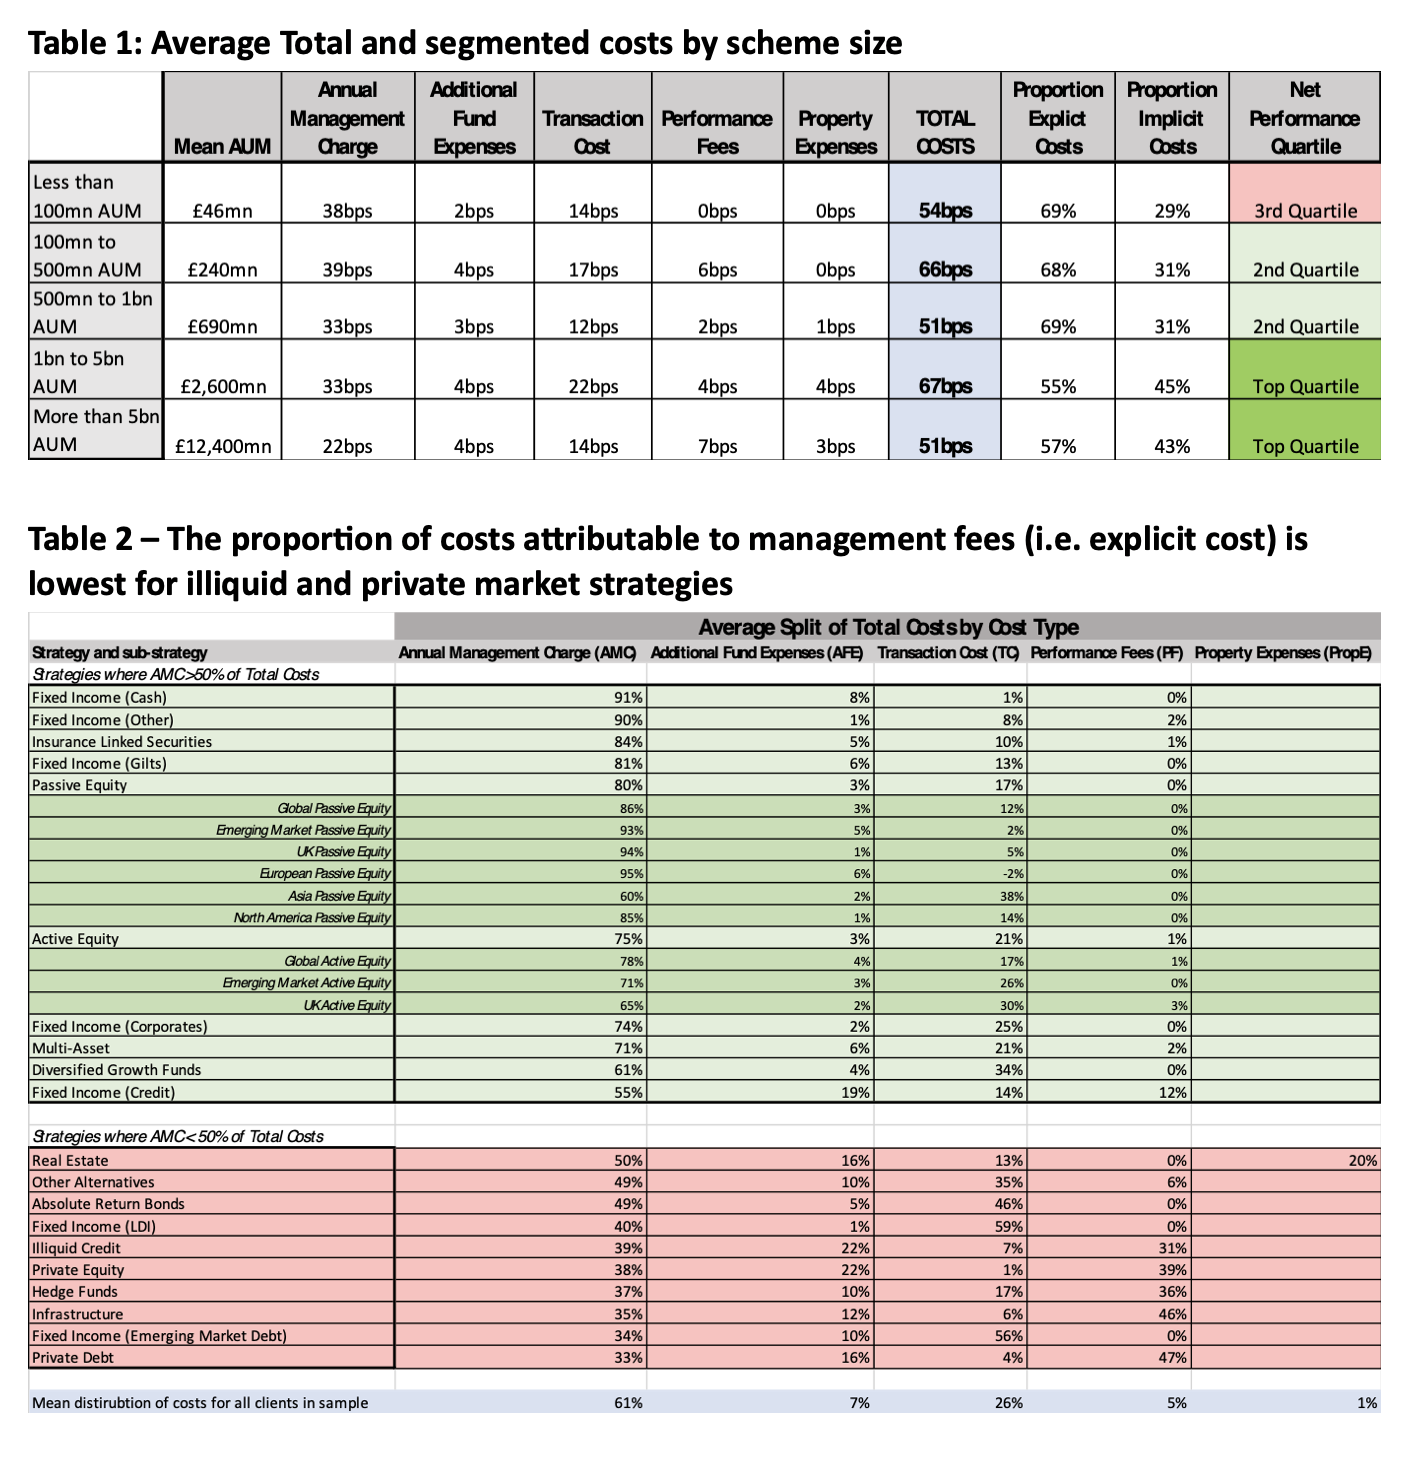
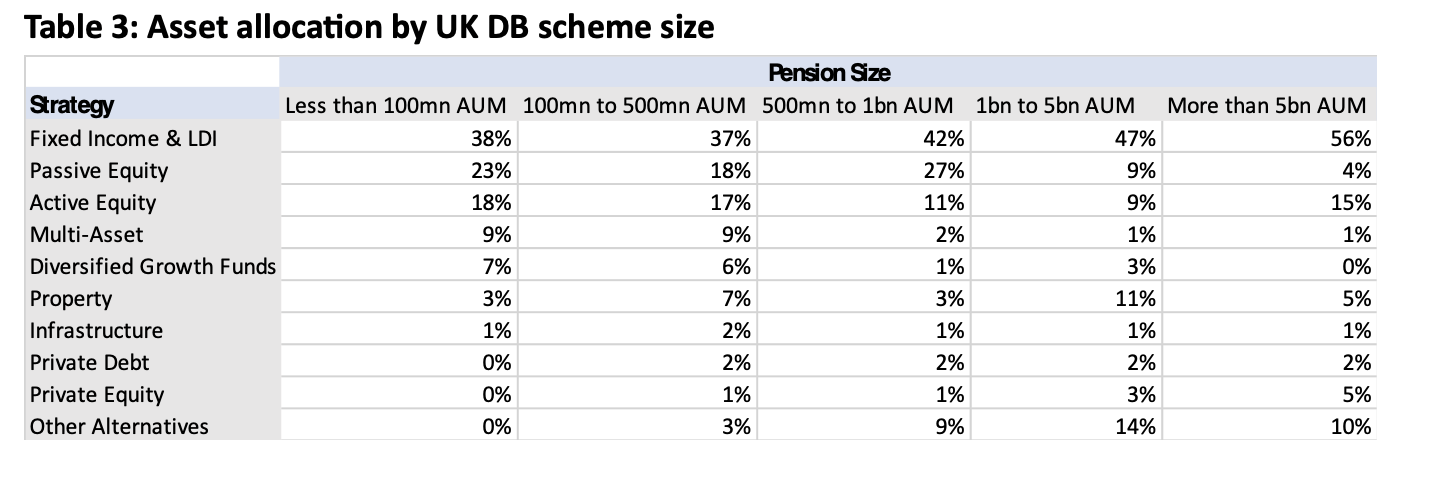
So, LGPS investment cost data is at best incomplete and at worst unavailable. Finding comparators though should not be complicated as I have lots of data for funds of similar size (Table 1) and possibly similar asset allocation (Table 3).
 However, there is an argument that LGPS funds are sufficiently different from other funds that there can be no external comparators. This may or may not be true, but what is true is that the data shown above, and the wider dataset and benchmarking data that is now available, will allow the LGPS to deal with its detractors.
Surge
What do I mean by this? At some point in the next year or two the LGPS will eventually have a complete set of cost data and this data is likely to show that LGPS total (investment) costs are some way north of the previous maximum reported figure of 35-40bps.
My data suggests that the likely total costs will be at least 50-70bps, based upon funds of similar size from the private sector (Table 1). When this cost increase is inevitably reported, the naïve or aggressive detractor will leap on it as evidence of weak governance and possibly profligacy on the part of LGPS funds and the SAB. After all, what other explanation can there be for the apparent inter-year surge in costs?
The real answer for the “surge” is that the costs were always there, they were just implicit and hidden from view, and that is what my data shows.
The LPGS should not shy away from comparisons with private sector funds, they should instead embrace them. By acknowledging the comparisons, the LGPS will be able to own the problem and counter the detractors.
But you might want to be quick about it; having incomplete cost data is only forgivable if everyone has incomplete cost data, and that is no longer the case. Nearly one thousand private sector schemes tell me that.
Dr Chris Sier is chairman of ClearGlass Analytics.
FREE monthly and weekly newsletters
Subscribe to Room151 Newsletters
Monthly Online Treasury Briefing
Sign up here with a .gov.uk email address
Room151 Webinars
Visit the Room151 channel