


Accounts have now closed but it’s hard to find the signs of financial resilience. Dan Bates reveals his observations on reserves and capital finance requirements.
I’ve spent years doing local authority final accounts closedown, chasing down accruals, trying to get my head around the code of practice and scrapping with auditors about rounding errors. And every year, I tell myself: This is the last year.
But over this time, I haven’t spent nearly as much time on considering what the accounts actually say, to the reader, in terms of the financial performance, health and standing. The events over recent years, and the last 12 months in particular, have sharpened the focus around financial stability and resilience of local authorities. So, the annual statement of accounts really should be important and meaningful documents. But are they?
This year, I have taken a good look at local authority accounts to see if I can understand how financially secure and resilient councils are, individually and collectively. This is no mean feat. To do this, I’ve had a look at 343 published sets of accounts for 2017–18. Here are some early observations.
Did everyone meet the one month earlier accounts deadline? 98% of authorities managed to publish accounts by 31 May, a month earlier than in previous years. Only eight appear to have missed the deadline. A fairly impressive performance.
Room151’s Annual Conference – September 20th, 2018, London Stock Exchange
Local Authority Treasurers’ Investment Forum and FDs’ Summit
Usable revenue reserves
A headline grabber earlier this year, following on from Northamptonshire’s s114 notice, it was revealed that two-thirds of upper tier authorities had depleted reserves in 2016–17.
A year on and things are a bit different. Local authority usable revenue reserves, have increased by just over 5% overall, but with wide variation between individual authorities and types of authority.
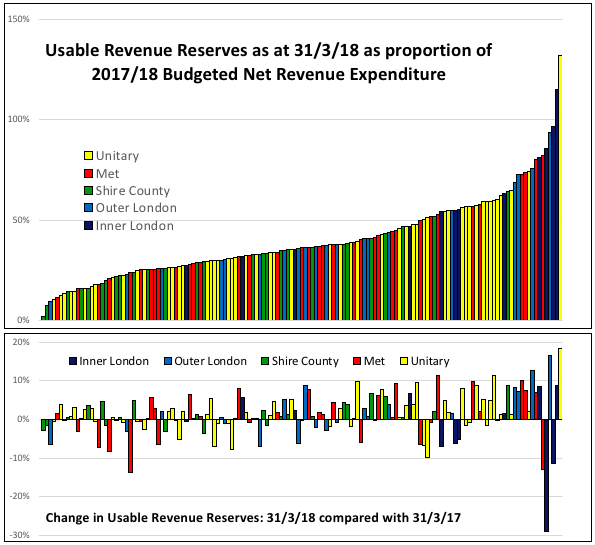
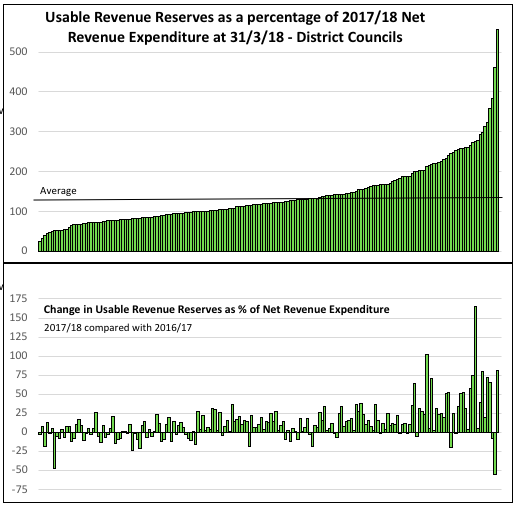
More than 50 (that’s over a third) of authorities with social care responsibilities saw reductions in usable revenue reserves in 2017–18. Districts as a whole increased reserves significantly and collectively have much higher reserves when compared with net revenue expenditure.
However, for the first time, 60 districts (just under a third) have depleted reserves suggesting signs of financial stress for some in this tier. My observations on the graphs:
- Clearly, a combination of reduced funding and social care pressures have had a significant impact on revenue reserves of top-tier authorities in the last few years and, whilst the increase in 2017–18 might infer that the position is stabilising, it is clear that some authorities continue to struggle with low, and falling, usable reserves levels. This indicates that demand pressures, leading to overspends, are still fairly common place.
- I attribute increasing district reserves primarily to the localised rates system which sees district councils benefit disproportionally from business rates growth (which may also partially explain why shire counties have the lowest revenue reserve levels by authority type). It is no surprise that these gains find their way into reserves as they may well disappear when business rates baseline are reset in 2020–21.
- Generally, districts with low levels of reserves were more likely to see further depletion in 2017–18. My guess is that these are the councils in areas with no, or low, growth in business rates, and I’d go further to hazard that many of these have not done so well from New Homes Bonus either.
So, demand-led pressures, reduced funding and reforms to local government funding, which have had major redistributive impacts, have left us with a wide variation in reserve levels.
With a fair funding review round the corner, I have to wonder how resilient some authorities will be to further funding shocks.
How important is the capital financing requirement?
There has, rightly, been a lot of media focus on levels of revenue reserves but what about other measures of financial resilience. One such area that has been in news is borrowing with some authorities signing up to large levels of borrowing to fund investment property acquisitions.
So, has borrowing increased? A review of long-term borrowing from 343 balance sheets shows that it has grown from below £56bn in 2016–17 to more than £59bn in 2017–18.
But this is only half the picture. The capital financing requirement (CFR) note usually tucked away at the back of the accounts calculates the total “underlying need to borrow” in order to fund capital expenditure, which includes actual and internal borrowing.
As such this provides a better picture of how much the authority will have to set aside from future revenue budgets to fund capital expenditure. The table below shows levels and changes in borrowing and capital financing requirements (expressed in terms of net revenue expenditure, NRE).
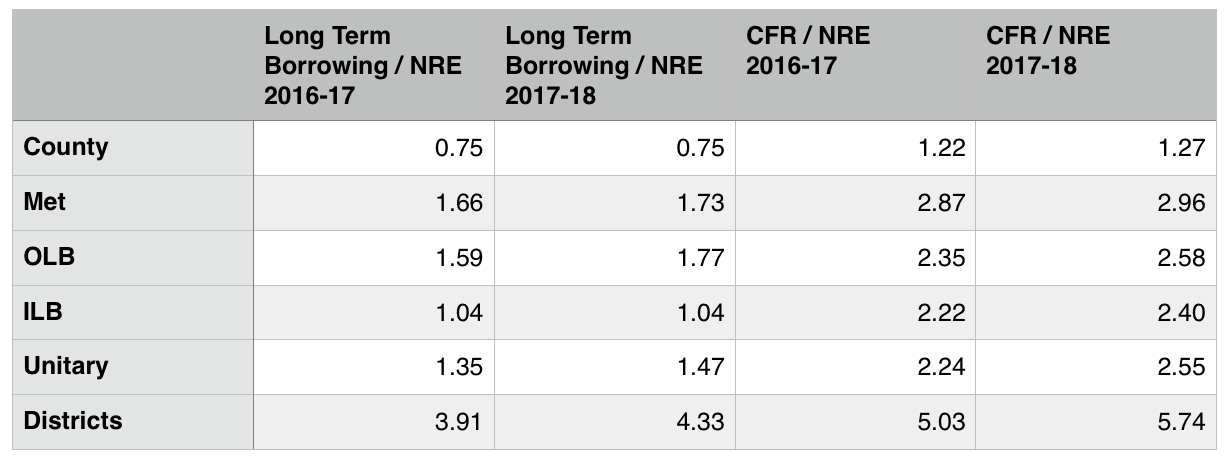
Capital financing requirements have increased for all types of authorities in 2017–18, particularly in unitaries and districts.
In fact, the average district has borrowed, externally and internally, almost six times its net revenue expenditure. This average is inflated by a small number of authorities which have taken significant borrowings to invest in property.
But is this a trend that should worry us? In theory no, because councils should be following the prudential code which requires them to show that the borrowing is affordable, sustainable and prudent. Many of the borrowing increases in 2017–18 are matched by increases in investment properties, which indicate that authorities are borrowing in order make higher investment returns.
There must be a point, though, when the capital financing requirement gets to a level where the revenue budget set aside for debt repayment becomes unsustainable. In my view, this is not immediately obvious from a review of the accounts in the way low usable reserves is.
Maybe for individual authorities a review of their CFR to NRE ratio compared to averages and other similar authorities may give an idea of relative financial resilience associated with capital financing.
Other balance sheet observations
A few of more things I gleaned from the accounts:
- Usable capital reserves have seen modest increases in 2017–18.
- Schools balances continue to tumble for the third year in a row indicating that a school funding crisis might be round the corner.
- Most authorities have fairly large pension deficits and these vary significantly. A large deficit impacts on resilience as annual pension costs might increase to fund such deficits. Only one authority in 343 has a pension surplus.
- Liquidity is falling across all types of authorities as current liabilities increase at a faster rate than current assets. Less liquid assets decreases the amount Councils can earn in interest, another financial pressure.
A good, useful, informative read?
Reading through the accounts, I continue to be struck by how difficult it is to get a genuine picture of financial resilience. So I hope the soon to be developed CIPFA code on financial reporting, which includes a resilience index, goes some way to making sure that financial statements provide a clearer picture of financial standing and an early indication of financial stresses.

Dan Bates works for Pixel Financial. His thoughts on local government funding are shared on twitter and LinkedIn.